Chapter 1. Cluster Observability Operator release notes
The Cluster Observability Operator (COO) is an optional OpenShift Container Platform Operator that enables administrators to create standalone monitoring stacks that are independently configurable for use by different services and users.
The COO complements the built-in monitoring capabilities of OpenShift Container Platform. You can deploy it in parallel with the default platform and user workload monitoring stacks managed by the Cluster Monitoring Operator (CMO).
These release notes track the development of the Cluster Observability Operator in OpenShift Container Platform.
1.1. Cluster Observability Operator 1.0
1.1.1. New features and enhancements
COO is now enabled for OpenShift Container Platform platform monitoring. (COO-476)
- Implements HTTPS support for COO web server. (COO-480)
- Implements authn/authz for COO web server. (COO-481)
- Configures ServiceMonitor resource to collect metrics from COO. (COO-482)
-
Adds
operatorframework.io/cluster-monitoring=trueannotation to the OLM bundle. (COO-483) - Defines the alerting strategy for COO . (COO-484)
- Configures PrometheusRule for alerting. (COO-485)
-
Support level annotations have been added to the
UIPluginCR when created. The support level is based on the plugin type, with values ofDevPreview,TechPreview, orGeneralAvailability. (COO-318)
-
You can now configure the Alertmanager
schemeandtlsConfigfields in the Prometheus CR. (COO-219)
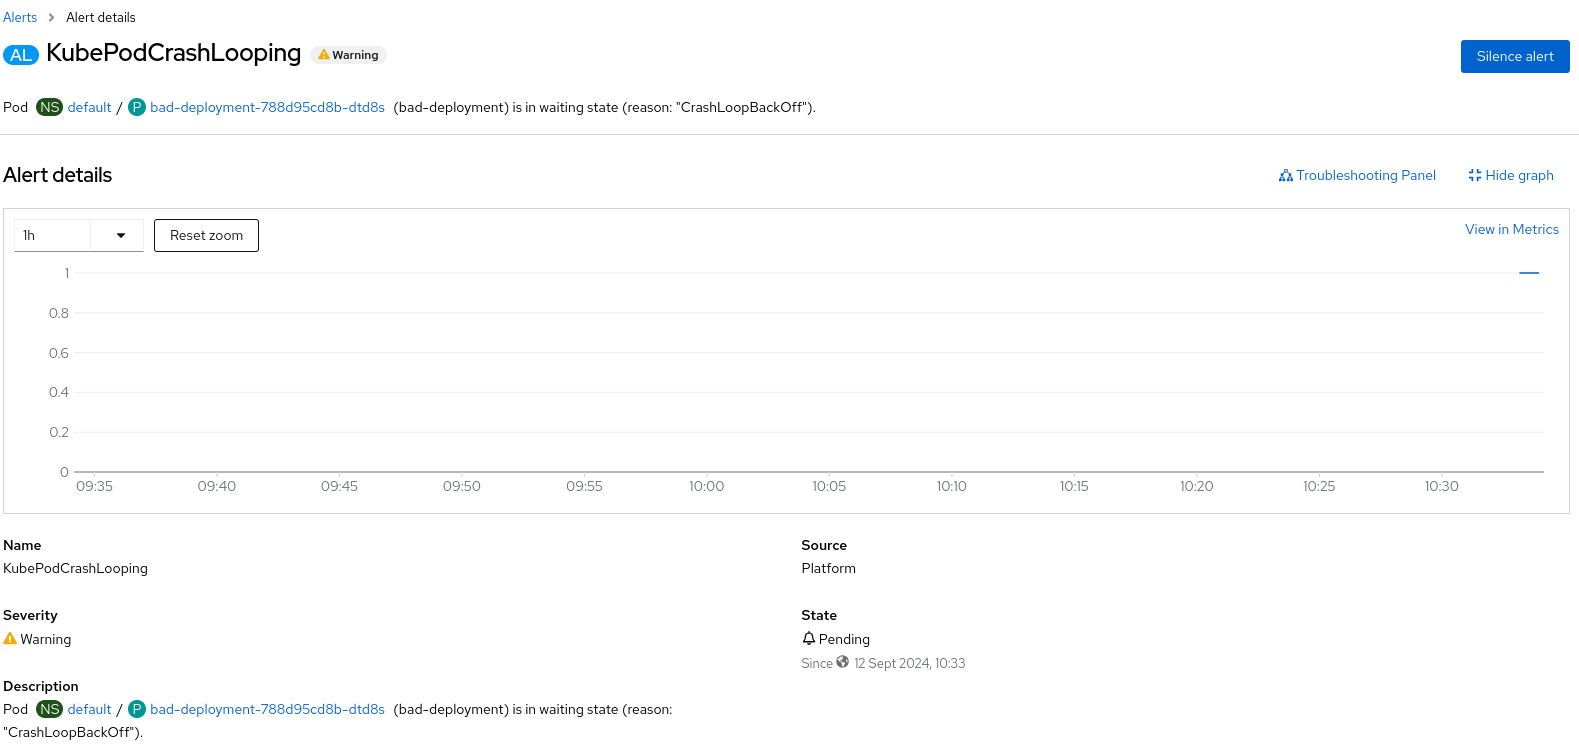
The extended Technical Preview for the troubleshooting panel adds support for correlating traces with Kubernetes resources and directly with other observable signals including logs, alerts, metrics, and network events. (COO-450)
-
You can select a Tempo instance and tenant when you navigate to the tracing page by clicking Observe → Tracing in the web console. The preview troubleshooting panel only works with the
openshift-tracing / platforminstance and theplatformtenant. - The troubleshooting panel works best in the Administrator perspective. It has limited functionality in the Developer perspective due to authorization issues with some back ends, most notably Prometheus for metrics and alerts. This will be addressed in a future release.
-
You can select a Tempo instance and tenant when you navigate to the tracing page by clicking Observe → Tracing in the web console. The preview troubleshooting panel only works with the
The following table provides information about which features are available depending on the version of Cluster Observability Operator and OpenShift Container Platform:
| COO Version | OCP Versions | Distributed Tracing | Logging | Troubleshooting Panel |
|---|---|---|---|---|
| 1.0+ | 4.12 - 4.15 | ✔ | ✔ | ✘ |
| 1.0+ | 4.16+ | ✔ | ✔ | ✔ |
1.1.2. CVEs
1.1.3. Bug fixes
-
Previously, the default namespace for the COO installation was
openshift-operators. With this release, the defaullt namespace changes toopenshift-cluster-observability-operator. (COO-32) -
Previously,
korrel8rwas only able to parse time series selector expressions. With this release,korrel8rcan parse any valid PromQL expression to extract the time series selectors that it uses for correlation. (COO-558) - Previously, when viewing a Tempo instance from the Distributed Tracing UI plugin, the scatter plot graph showing the traces duration was not rendered correctly. The bubble size was too large and overlapped the x and y axis. With this release, the graph is rendered correctly. (COO-319)
1.2. Features available on older, Technology Preview releases
The following table provides information about which features are available depending on older version of Cluster Observability Operator and OpenShift Container Platform:
| COO Version | OCP Versions | Dashboards | Distributed Tracing | Logging | Troubleshooting Panel |
|---|---|---|---|---|---|
| 0.2.0 | 4.11 | ✔ | ✘ | ✘ | ✘ |
| 0.3.0+, 0.4.0+ | 4.11 - 4.15 | ✔ | ✔ | ✔ | ✘ |
| 0.3.0+, 0.4.0+ | 4.16+ | ✔ | ✔ | ✔ | ✔ |
1.3. Cluster Observability Operator 0.4.1
The following advisory is available for Cluster Observability Operator 0.4.1:
1.3.1. New features and enhancements
- You can now configure WebTLS for Prometheus and Alertmanager.
1.3.2. CVEs
1.3.3. Bug fixes
-
Previously, when you deleted the dashboard UI plugin, the
consoles.operator.openshift.ioresource still containedconsole-dashboards-plugin. This release resolves the issue. (COO-152) - Previously, the web console did not display the correct icon for Red Hat COO . This release resolves the issue. (COO-353)
- Previously, when you installed the COO from the web console, the support section contained an invalid link. This release resolves the issue. (COO-354)
- Previously, the cluster service version (CSV) for COO linked to an unofficial version of the documentation. This release resolves the issue. (COO-356)
1.4. Cluster Observability Operator 0.4.0
The following advisory is available for Cluster Observability Operator 0.4.0:
1.4.1. New features and enhancements
1.4.1.1. Troubleshooting UI plugin
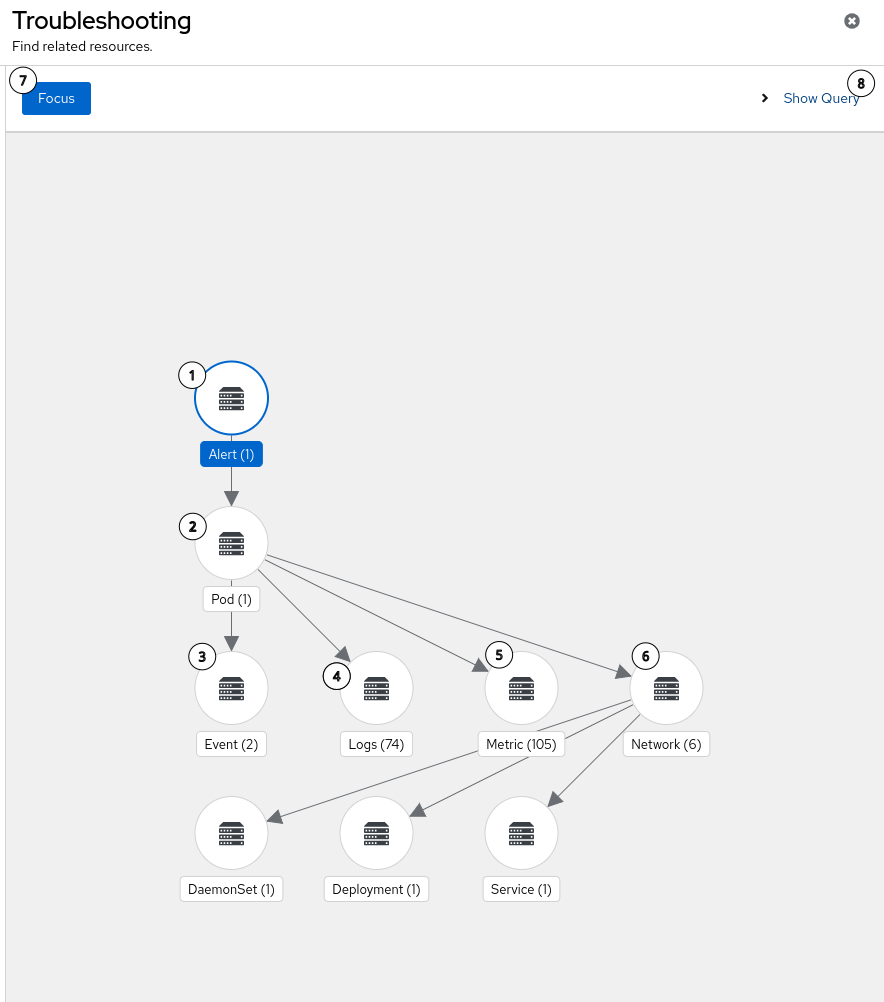
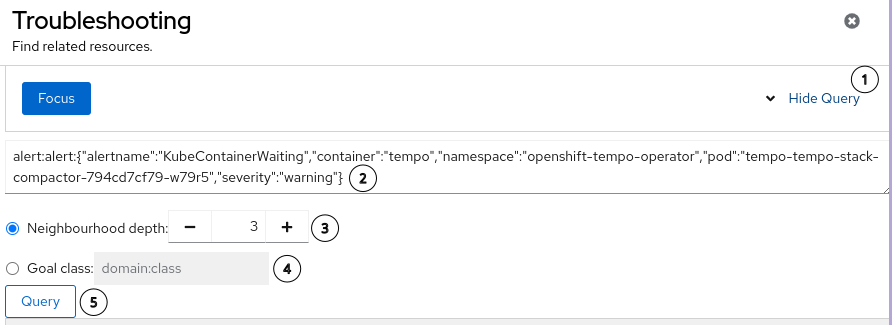
- The troubleshooting UI panel has been improved so you can now select and focus on a specific starting signal.
- There is more visibility into Korrel8r queries, with the option of selecting the depth.
-
Users of OpenShift Container Platform version 4.17+ can access the troubleshooting UI panel from the Application Launcher
 . Alternatively, on versions 4.16+, you can access it in the web console by clicking on Observe → Alerting.
For more information, see troubleshooting UI plugin.
1.4.1.2. Distributed tracing UI plugin
- The distributed tracing UI plugin has been enhanced, with a Gantt chart now available for exploring traces.
For more information, see distributed tracing UI plugin.
1.4.2. Bug fixes
- Previously, metrics were not available to normal users when accessed in the Developer perspective of the web console, by clicking on Observe → Logs. This release resolves the issue. (COO-288)
- Previously, the troubleshooting UI plugin used the wrong filter for network observability. This release resolves the issue. (COO-299)
- Previously, the troubleshooting UI plugin generated an incorrect URL for pod label searches. This release resolves the issue. (COO-298)
-
Previously, there was an authorization vulnerability in the Distributed tracing UI plugin. This release resolves the issue and the Distributed tracing UI plugin has been hardened by using only multi-tenant
TempoStackandTempoMonolithicinstances going forward.
1.5. Cluster Observability Operator 0.3.2
The following advisory is available for Cluster Observability Operator 0.3.2:
1.5.1. New features and enhancements
-
With this release, you can now use tolerations and node selectors with
MonitoringStackcomponents.
1.5.2. Bug fixes
-
Previously, the logging UIPlugin was not in the
Availablestate and the logging pod was not created, when installed on a specific version of OpenShift Container Platform. This release resolves the issue. (COO-260)
1.6. Cluster Observability Operator 0.3.0
The following advisory is available for Cluster Observability Operator 0.3.0:
1.6.1. New features and enhancements
- With this release, the Cluster Observability Operator adds backend support for future OpenShift Container Platform observability web console UI plugins and observability components.
1.7. Cluster Observability Operator 0.2.0
The following advisory is available for Cluster Observability Operator 0.2.0:
1.7.1. New features and enhancements
- With this release, the Cluster Observability Operator supports installing and managing observability-related plugins for the OpenShift Container Platform web console user interface (UI). (COO-58)
1.8. Cluster Observability Operator 0.1.3
The following advisory is available for Cluster Observability Operator 0.1.3:
1.8.1. Bug fixes
-
Previously, if you tried to access the Prometheus web user interface (UI) at
http://<prometheus_url>:9090/graph, the following error message would display:Error opening React index.html: open web/ui/static/react/index.html: no such file or directory. This release resolves the issue, and the Prometheus web UI now displays correctly. (COO-34)
1.9. Cluster Observability Operator 0.1.2
The following advisory is available for Cluster Observability Operator 0.1.2:
1.9.1. CVEs
1.9.2. Bug fixes
- Previously, certain cluster service version (CSV) annotations were not included in the metadata for COO. Because of these missing annotations, certain COO features and capabilities did not appear in the package manifest or in the OperatorHub user interface. This release adds the missing annotations, thereby resolving this issue. (COO-11)
- Previously, automatic updates of the COO did not work, and a newer version of the Operator did not automatically replace the older version, even though the newer version was available in OperatorHub. This release resolves the issue. (COO-12)
-
Previously, Thanos Querier only listened for network traffic on port 9090 of 127.0.0.1 (
localhost), which resulted in a502 Bad Gatewayerror if you tried to reach the Thanos Querier service. With this release, the Thanos Querier configuration has been updated so that the component now listens on the default port (10902), thereby resolving the issue. As a result of this change, you can also now modify the port via server side apply (SSA) and add a proxy chain, if required. (COO-14)
1.10. Cluster Observability Operator 0.1.1
The following advisory is available for Cluster Observability Operator 0.1.1:
1.10.1. New features and enhancements
This release updates the Cluster Observability Operator to support installing the Operator in restricted networks or disconnected environments.
1.11. Cluster Observability Operator 0.1
This release makes a Technology Preview version of the Cluster Observability Operator available on OperatorHub.